
Power SCADA System (Power Monitoring & Peak Management)
Power SCADA System
Brings the data from the main substation and the individual VCBs and ACBs in each local substation onto one screen to monitor power consumption and peaks by area. Voltage, current and energy consumption are stored in a database for daily and monthly review, together with alarm and trip history.
Your electricity bill is driven more by a single 15-minute peak than by a whole month of careful use.
Yet most plants only learn last month's peak when the utility bill arrives.
By then there is no way to find out which area, which time of day, or which equipment pushed it up.
Power SCADA gathers the circuit breaker data from the main substation and every local substation in one place. You see on screen how much you are using now, which areas use the most and when the peak occurred, and the data is stored in a database so it can be pulled up again later.
Screen layout
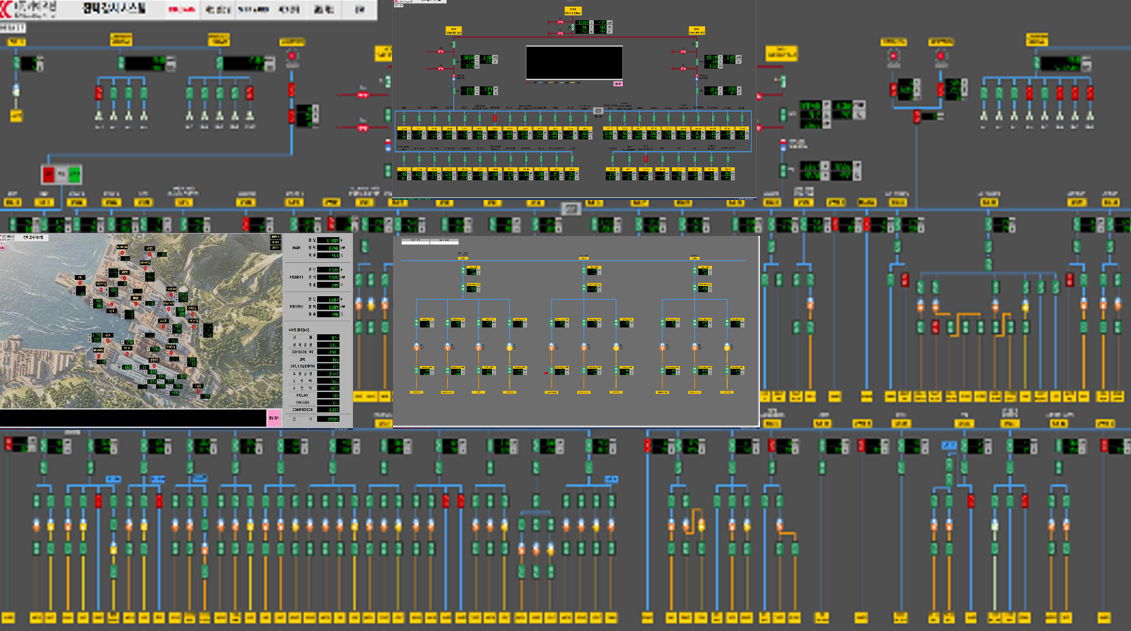
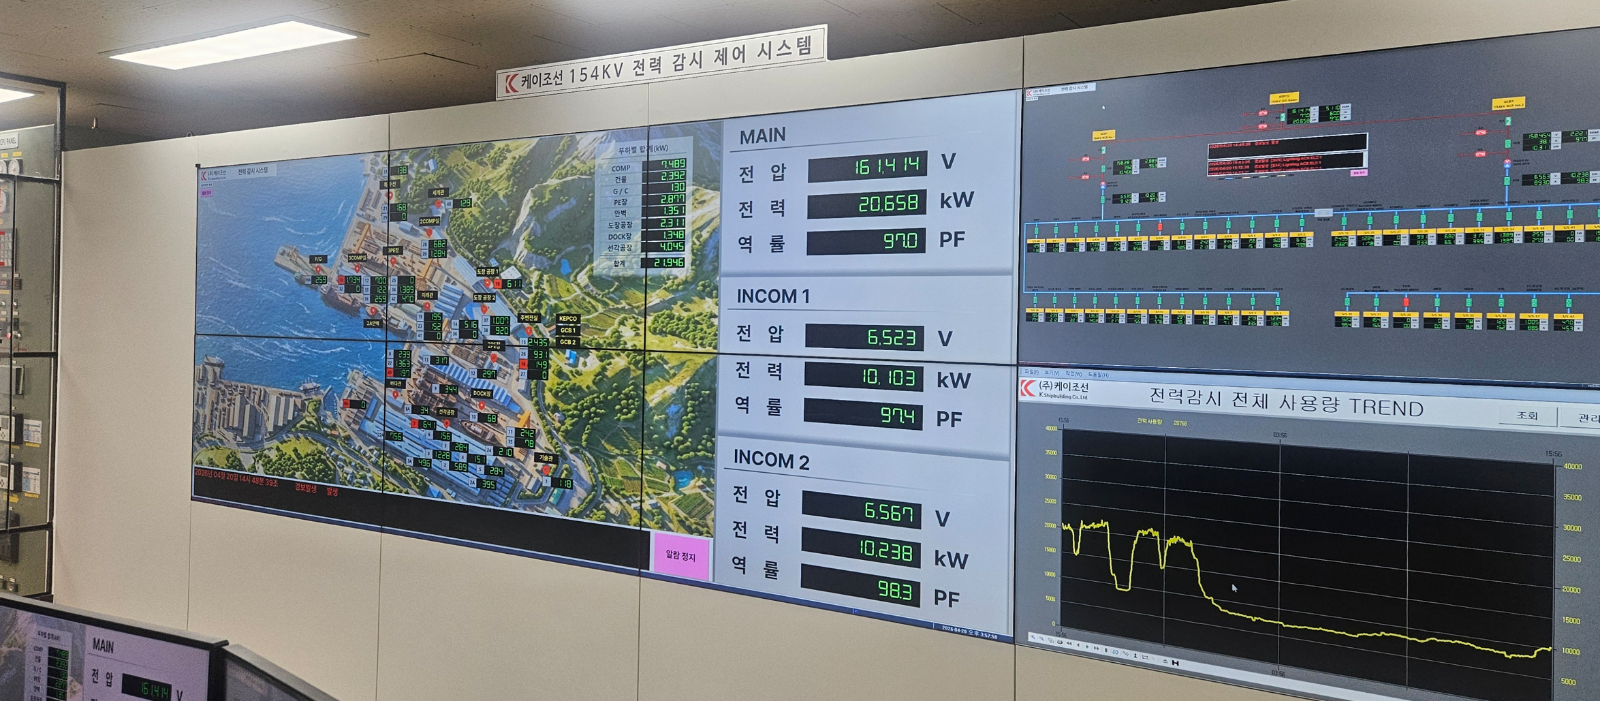
Screens are divided according to the size of the site and the number of substations. Below is the screen layout of a system we actually built.
Screen | What it shows |
|---|---|
Overall single-line diagram | The complete distribution single-line diagram, with breaker open/closed status and voltage, current and power per circuit overlaid on the diagram |
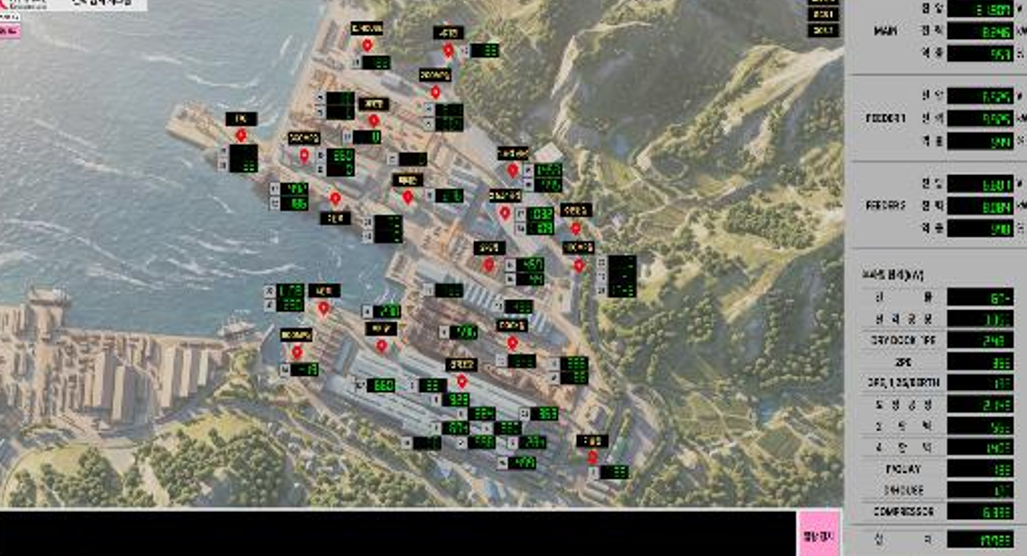
Status by area | Power consumption by area and building overlaid on the site plan, so you can see at once where the most is used |
Individual substation | One substation expanded to show every VCB and ACB in full |
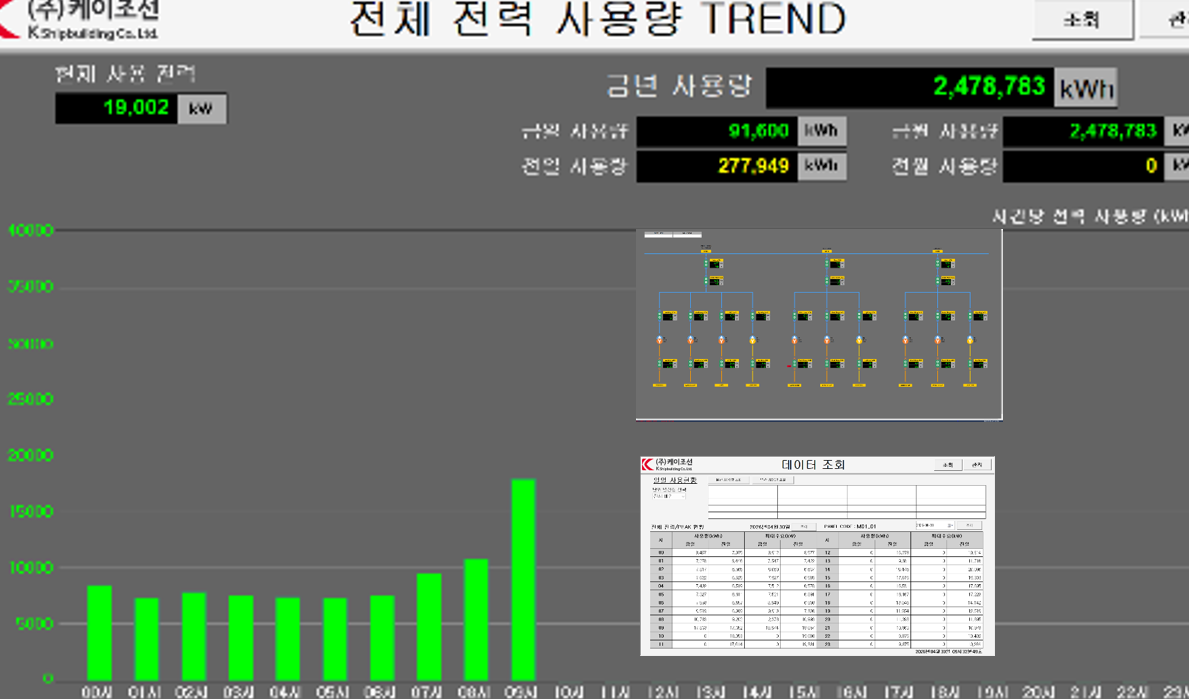
Consumption trends | Monthly and daily consumption graphs, compared with the same period last year |
Data lookup | Consumption and operating hours by time of day in table form, for a chosen period and target |
Alarms · trips | History lookup with occurrence and recovery times |
Key functions
Function | Description |
|---|---|
Consumption by area | Aggregates power consumption by area. Provides the basis for allocating power costs to departments or lines |
Individual VCB/ACB lookup | Select a single breaker to view its consumption history as a graph |
Peak management | Shows current demand alongside the target and records when peaks occur |
Full substation data | All circuits of each substation gathered on one screen |
Alarm · trip monitoring | Notifies breaker trips and abnormal conditions in real time and stores the history |
Simply displaying peak management on screen is already effective.
When you can see demand approaching the target, you can decide to postpone equipment scheduled for that time. Going one step further, automatic load shedding and restoration control can be added.
Data server
In power SCADA, data matters as much as screens. Once voltage, current and energy consumption are in a database, they do not stop there; they can be passed on to a higher-level management system.
Category | Data stored |
|---|---|
Main substation | Main power data |
Local substations | Full power data for every individual VCB and ACB |
Measured items | Voltage, current, power, energy consumption, power factor and more |
Uses | Daily and monthly lookup, Excel download, interface to a higher-level energy management system |
[Photo 5] Data lookup — alt: table
It works with existing substations too
It does not have to be a new substation.
Most protection relays and energy meters today have a communication port (Modbus and others), so monitoring is added by reading those signals.
For older devices without communication, a meter is added only on the circuits concerned.
In other words, there is no need to replace breakers or schedule a long outage.
Where substations are spread across several locations, a local data collector is placed in each and they are networked together and integrated centrally.
Substations added later connect in the same way.
How a project proceeds
Stage | What we do |
|---|---|
1. Site survey | Check substation configuration, breaker and relay lists, communication support and network condition |
2. Point list | Fix which values, and how many, are read from each circuit. This is where scale and quotation are determined |
3. Screen design | Draw the single-line diagram and site plan from the actual drawings |
4. Server · network | Build the database and set the collection interval and retention period |
5. Installation · commissioning | Communication wiring and value verification, comparing actual meter readings with screen values |
6. Handover | Training on lookups and reports, alarm response and backup procedures |
If you also want to bring compressor load under control along with peak management, see the "Air Compressor Load Sharing System (LSS)" page; if you need monitoring screens for the plant as a whole, see "Integrated HMI & SCADA Systems".